The goal of these pages is to
discuss long-term trends and risks affecting financial markets and the broader
economy rather than to analyze the torrent of monthly data hitting newswires.
But the data flow of the past week merits a look as it ties into the running
narrative of recent postings. Last week saw the release of the ISM’s Purchasing
Managers’ Indices for both the manufacturing and non-manufacturing sectors.
These reports feature components considered leading indicators, thus able to
predict the economy’s health over the coming months. While Friday’s government
jobs report is more of a backward-looking indicator, it does provide an
accurate snapshot of economic conditions relative to past periods of recovery. The
conclusion is not pretty, which is why the information imbedded in the forward-looking
indicators is of such importance. These data also continue to build the case
for the Fed to reveal perhaps the worst-kept secret in financial markets, which
is its impending decision to undertake further extraordinary action to support growth
despite the diminishing returns of such steps and the potential for unleashing
longer-term unintended consequences. So much for the Hippocratic Oath’s central
premise of first do no harm.
The PMI: Straight from the Trenches
The Purchasing Manager’s Index
(PMI) for the manufacturing sector is a diffusion index meaning readings above
50 represent expansion in the sector and those below signal contraction. Data
are collected via a survey of industry decision-makers regarding activities
such as production and staffing expectations, new orders and inventories among
other sub-series. In other words, the respondents have skin in the game. As
with other indicators, recessionary periods are usually followed by a string of
strong data as the economy plays catch up on the back of pent-up demand. That
was indeed the case during late 2009 and into 2010. Since 2011, however, growth
as measured by the PMI has sputtered, with the past two months coming in negative.
(note: given manufacturing’s diminishing role in the U.S. economy, a negative
PMI does not necessarily translate into broader economic contraction, but given
the sector’s magnifier effect,
negative readings do send up a red flag).

As seen in the second chart, the
PMI itself along with key subcomponents have all tapered off from 2011’s pace. The
Non-Manufacturing PMI measures activity in the 80-plus percent of the economy
outside the manufacturing sector. Recent data here also have slowed, though the
index has remained positive (above 50). Back to the manufacturing sector, the
early stage of the recovery was fueled by growth in factory production, partly
due to strong exports thanks to robust demand from emerging markets. Recession
in Europe, which accounts for one-fifth of U.S. exports, along with a slowdown
in emerging Asia, ended that party. Indeed, during latter-2009 and through
2010, often one-half of quarterly GDP growth was attributable to rising exports
(though much of the boost was offset by import growth….a constant thorn in the side
of the U.S. economy).

The Inventory Situation
A particularly telling component
of the PMI is the New Orders sub-index, by definition forward-looking. New
Orders for both the PMI and the Non-Manufacturing PMI have fallen over 2012
with the manufacturing version dipping into contraction territory. Analysts
often reference the relationship between new orders and inventory levels to
determine whether future demand merits increased production (thus greater
economic activity) or if weaker orders signal slower growth as suppliers draw
down existing inventory. As seen below, the difference between the two
sub-indices turned (very) negative during the crisis and again has reached
negative territory, far below the difference’s long term average of 8.5. The
take-away: the second quarter’s positive contributor to GDP by inventory
build-up may be reversed in the latter half of the year unless demand rises to
absorb products sitting in the nation’s warehouses and loading docks.

The ability of America’s
factories to calibrate production in order to meet future demand is more of an
art than a science and thus results in something of a yo-yo effect on GDP as firms
build up then eat through inventory depending upon the level of demand for products.
This process has become all the more arduous given the economy’s tepid growth,
cautious consumers and tight lending standards, not to mention attempts to
divine how loose monetary policy will impact these demand-dynamics (this answer
so far: it hasn’t).

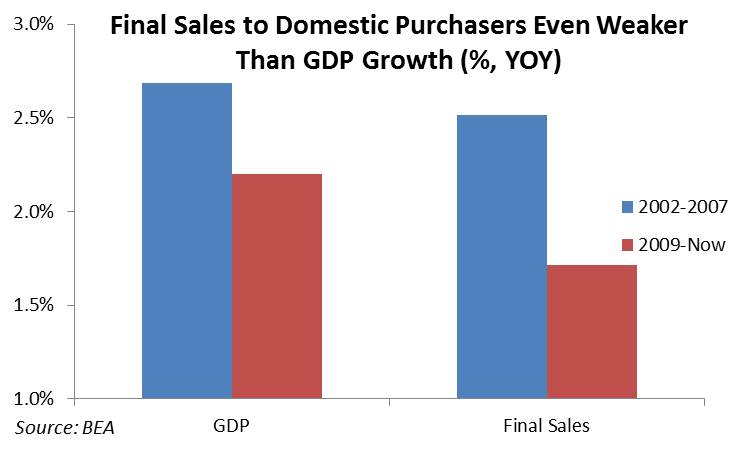
One way to gauge the underlying
demand of the economy is to factor out quarterly inventory changes. One such
measure worth paying attention to is final
sales to domestic purchasers. In the past we have harped on how GDP growth
since the nominal beginning of the
recovery in mid-2009 has lagged growth from earlier in the decade. The
situation is even starker for the final sales figures. As seen below, when
tossing overseas sales and inventory effects out of the equation, home-grown
demand has simply not returned. May have something to do with a traumatized
labor force and the end of easy credit for much of middle-America.
Back to Jobs
Friday’s jobs report showed an increase
in payrolls of 163,000, a strong rebound after three months of sub 70,000
growth. The July figure is above the accepted threshold of what is necessary to
keep up with population gains. Still one cannot forget that growth should be
dramatically higher during a recovery in order to draw idled-workers back into
the nation’s factories and offices. It
has been 55 months since the country officially
entered the great recession. Despite
a few blips, job growth has remained positive since early 2010. But the pace
has been nowhere near sufficient to quickly bring down the ranks of the
unemployed. At this stage of the recession-recovery cycle, this period has been
the only one of the past four U.S. recessions to have yet recovered the jobs lost.


The Mosaic
Although the July jobs report
exceeded (low) expectations, one month does not a trend make, especially when
seasonal factors could lead to revisions. The longer-term data, some of which
has been highlighted here, illustrate the tenuous position of the U.S. economy.
It is for this reason that most analysts expect the Fed to mount its horse and
chase down a few more windmills by purchasing additional bonds, perhaps before
the autumn leaves begin to turn (and Americans go to the polls….oh what a
political hornet’s nest that move will be). By policy-makers’ own admissions,
continued accommodative steps will likely have diminished impact. Rates are, after
all, at historic lows. As evidenced by Friday’s market rally, the Fed’s
repeated attempts to resuscitate the economy are mainly felt by creating whippy
trading opportunities. Short-term gain (depending upon which side of the trade
you are on), longer-term ambiguity. The tall-task of expecting such measures to
solve deeply-rooted economic ills is best captured by the adage: The good news is that the ambulance is here.
The bad news is that you need an ambulance.
No comments:
Post a Comment