Nothing like a few
sessions in the red after a nearly unbroken upward march in equity prices to
get investors…..belatedly….questioning the fundamentals underpinning the
S&P 500 at its record high. Since reaching 1,669 on May 21st,
the S&P has retreated in seven of the last 12 trading sessions and is
presently 1.5% off its peak. Before hitting the panic button….something
investors have evidently forgotten about…keep in mind the index finished last
week with two strong sessions…despite a luke-warm jobs report…and is still up
15.2% in 2013. Given last week’s rebound, investors do not seem overly worried
about equities venturing into such thin air. Any combination of three concepts
seems to be buoying sentiment towards the market. First, and the rosiest
scenario, is that investment analysts, being forward-looking and relatively
sharp, expect the economy to expand over the remainder of the year, which will
create a steady tailwind for (much-delayed) sales and earnings growth. A second
theory, especially popular during the early part of the year, is that markets
are benefiting from the return of retail investors who had continued to be in a
state of post-crisis shell shock. Under this scenario, pent-up demand for
shares as they climb higher would be enough to expand P/E ratios, thus creating
something of a virtuous cycle as more and more investors fear missing the boat.
Lastly, and most cynically, is the idea that equities are being driven by the
Fed’s policy of forcing investors further out along the risk spectrum in search
of respectably yielding assets. Under this distortion
scenario, equity gains are the function of macro-policy, virtually
disconnected from underlying company performance or economic developments. But
fundamentals do matter. And the recent stream of economic data causes the
neurotically risk-averse investor (the best kind) to lay awake at night
questioning current valuations.
Fearlessly Into the Stratosphere
Since November, the S&P 500 has
been on a tear. In classic bull-market style, lousy news is ignored and
anything marginally positive is reason to increase the bid. In a nod to
technical analysts, since the 50-day moving average crossed north of the
200-day moving average (this event alone being considered a bullish
development), the former line has provided a floor to any pullback in prices.

If you feel comfortable enough to
wager your kid’s college tuition fund on such concepts, then more power to you.
For those who prefer more
fundamentally-based rationale, there is some of that too. Based on earnings
estimates for the next four quarters compiled by S&P Indices, the S&P 500’s
forward P/E ratio is 14.6, still attractively priced by historical standards. One
must keep in mind that the much-ballyhooed P/E ratio has two components, the
price (numerator) and earnings (denominator). It is a positive sign that even
as investors have bid equities to record highs, the consequent expansion of the
P/E ratio has still left it at a relatively attractive…and plausible…level,
unlike during the dot.com bubble. But what is that price buying? The answer to
that is in the denominator, and it is less than encouraging. Again using
S&P Indices data, earnings estimates for the current quarter have been
revised down 4.7% since the beginning of the year. Third-quarter estimates have
been curtailed 2.6% and for the entire year, EPS has been trimmed by 2.4%.
Do You Still Love Me?
Much talk during this year’s first
quarter was that of the great rotation
from bonds into equities, which had been unloved since the nadir of the
financial crisis. These pages too delved into the subject, and like everyone
else, we clearly jumped the gun. According to data from the Investment Company
Institute, January’s surge into equities proved to be an outlier. Since then
flows into global equity funds have turned into a trickle. For U.S.-focused
funds, the situation is worse, with three of the past four months seeing net outflows.

This torpedoes the theory that
pent-up demand from previously sidelined retail investors will provide support
for a continued run-up in equity prices. This absence of inflows is also
reflected in muted trading volume during the rally. Below-average volume infers
that investors currently in the market are happy to let some players (likely pulseless
algorithms) jack up their portfolio values, but are not willing to allocate any
still-ample amount of idle cash towards additional share purchases.

Under the rosy scenario, if investors are correct then their bet on equities
will pay off in the form of GDP expansion, which will create fertile ground for
corporations to raise prices and undertake long-delayed hiring. In yet another
virtuous circle, this catalyzes demand from the country’s all-important
consumer segment. Recent data, however, has suggested the contrary is occurring.
Digging into the granular data imbedded in key manufacturing and employment
reports reveals that for the third year running the U.S. economy may in the
midst of yet another bout of subpar growth. (*note: and no, tepid data, which manage to beat low-balled consensus
estimates, are not reasons to pop the corks).
An Index Worth Paying Attention To
A favored economic barometer among
investors and strategists is the monthly PMI Manufacturing Survey conducted by
the Institute for Supply Management. As Alan Greenspan inferred, this index
gauges the outlook of corporate managers who have skin in the game by making
capital investment and hiring decisions. The chart below shows the trajectory
of both the more-established Manufacturing PMI and the newer Service PMI, which
tracks some 80% of the U.S. economy. While the Service PMI covers the larger
segment, the manufacturing index is considered a bellwether, given the multiplier
effect this sector has on the broader economy.
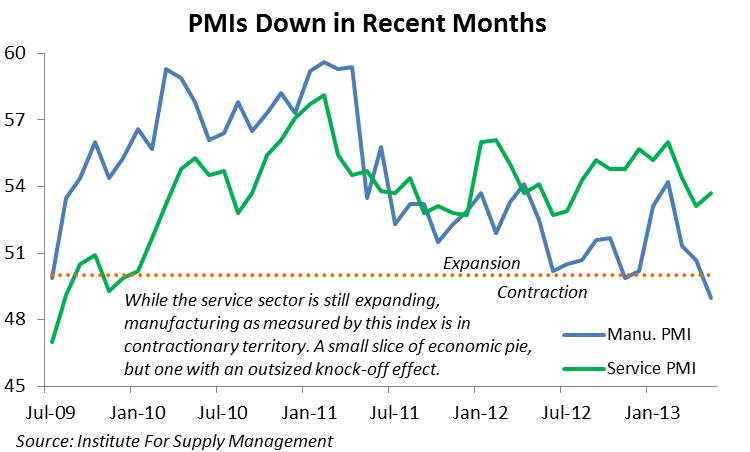
Since the beginning of the year,
both indices have been trending down, with the manufacturing PMI reaching into
contracting (sub-50) territory. That is not as dire as it seems. Over the past
several decades, manufacturing has continued to play a diminished role in the
U.S. economy, meaning that it often contracts even during the good times. The
ISM states that any reading on the manufacturer’s index over 42 infers that the
overall economy is still heading in the right direction. In that vein, May’s
reading of 49 is not the end of the word. But still neither index has enjoyed a
robust spring.
Perhaps more worrisome is the data
contained in the sub-indices. For manufacturers, a key barometer of future
demand is the relationship between new orders and existing inventories. If
inventories rise relative to orders, factories are likely to curtail production
until warehouses empty some of their shelves. For much of the past two years…and
especially in recent months…the difference between new orders and inventories
has been below average. With existing inventory sufficient to meet muted demand,
managers see little need to make capital investment or hire additional workers.

For much of the early part of the …ahem….recovery….the
nation’s manufacturers did more than their fair share to make up for the
traumatized, unemployed and deleveraging U.S. consumer. Much of the demand for
these factories’ products came from abroad, especially from emerging markets
keen to purchase high quality capital goods to build out their infrastructure
and update their manufacturing capabilities. This trend has grown long in the
tooth with both the production and exports sub-indices falling over the past
several months.

Related to this is recent data on
new orders for durable goods. A key component of this monthly report is
nondefense capital goods ex-aircraft, which serves as a proxy for business
spending. When companies are optimistic about future sales prospects, they are
more likely to invest in capital goods, which are often financed on credit.
Conversely, a lower level of orders infers that businesses have reservations
about coming quarters and may not want to make leveraged investment. This may
be what we are seeing now with the three-month average (to smooth out
volatility) for year-on-year changes in new orders dipping into negative
territory.

Lower investment by the nation’s
businesses can lead to lower productivity gains in the future and also hint
that firms may be equally unwilling to invest in additional workers. Back to
employment…and the PMI indices….jobs sub-indices for both the manufacturing and
service sectors have fallen over much of the year. As seen below, downward
trends in these indices (combined here) have largely reflected softness in job
creation as measured by the nonfarm payrolls report.

More Jobs: But the Wrong Kind
Friday’s jobs report showed a gain
in nonfarm payrolls of 175 thousand, roughly in-line with the 12-month average.
Good….but not good enough. Of the 8.4 million jobs lost by the height of the
recession, nearly three-quarters have been recovered. To absorb the remaining
two million….in addition to the nearly 150,000 that enter the workforce each
month, at the current rate (176k) it would take over six years. Not the news
anyone wants to hear.

Equally unsettling is which types
of jobs are being created. Since the beginning of the year, there have been 946
thousand new jobs created. But 38% percent of those have come from temporary
service companies ((111k), retail positions (93k) and food and beverage
establishments (160k). Being a barista or haberdasher is a noble way to make
ends meet during tough times, but these are not the high-paying jobs that will
lead to a renaissance in consumer spending. And as stated ad nauseum, at 70% of
the economy, personal consumption is a necessary component to any lasting
recovery. What is an example of jobs better suited for fueling overall economic
growth? Manufacturing is one. But from mid-2006 to mid-2009 the U.S. shed 2.49
million manufacturing positions. Since then, only 246 thousand have been
recovered. Would you like skim, soy or
2% milk in your latte, sir?
Retail Sales
With jobs data like this, one must
wonder whether the consumer can marshal the strength to be an incremental
contributor to economic growth in the near future. Any thought that that may be
the case is diminished when viewing recent retail sales data. Core retail
sales, which strips out auto sales, gasoline and building materials (and better
aligns with the personal consumption figure in GDP data), rose 3.3% YoY in
April; the worst reading since July 2010. The
respectable gains from the end of the crisis through mid-2011 are long
since passed, and much of those were likely the consequence of a base effect
from a truly horrific period in 2009 and early 2010.

Credit Cards to the Rescue
Paradoxically, there is one iota of
positive news on the consumer front. While nonrevolving credit for consumers who
actually won’t have a banker hang up on them has risen over the past two-plus
years, outstanding credit card debt has been the laggard. This has finally
begun to change with Q1’s YoY figure rising 1.6%. We’ll take the good news
where we can get it.

No comments:
Post a Comment